Real Time Eeg Visualization
This spike describes different tools to visualize EEG data in real time streamed from LSL.
LSL-SigVisualizer
The repo for SigVisualizer can be found here. The benefit of this tool is that it is written in Python so it uses the same pylsl library as BCI-essentials-python. I was unable to run the tool when trying to look at a simulated stream using the script bci-essentials-python/examples/eeg_lsl_sim.py. I kept getting the following error:
TypeError: arguments did not match any overloaded call:
  drawLine(self, l: QLineF): argument 1 has unexpected type 'float'
  drawLine(self, line: QLine): argument 1 has unexpected type 'float'
  drawLine(self, x1: int, y1: int, x2: int, y2: int): argument 1 has unexpected type 'float'
  drawLine(self, p1: QPoint, p2: QPoint): argument 1 has unexpected type 'float'
  drawLine(self, p1: Union[QPointF, QPoint], p2: Union[QPointF, QPoint]): argument 1 has unexpected type 'float'
The tool seems to be easy to use (if we get it to work). It lets you select the stream you want to visualize, but since I was not able to run the tool, I do not know if there are hot keys to change the amplitude or time scale of the live plot.
Stream viewer
The repo for stream viewer can be found here. The repo has to be installed in the Python environment using the command
pip install git+https://github.com/intheon/StreamViewer.git
Then, the desired application can be run using the following command from the Anaconda environment
python -m stream_viewer.applicaitons.{application_name}
The application I used to visualize EEG data is lsl_linevis. The resulting visualization looks someting like this:
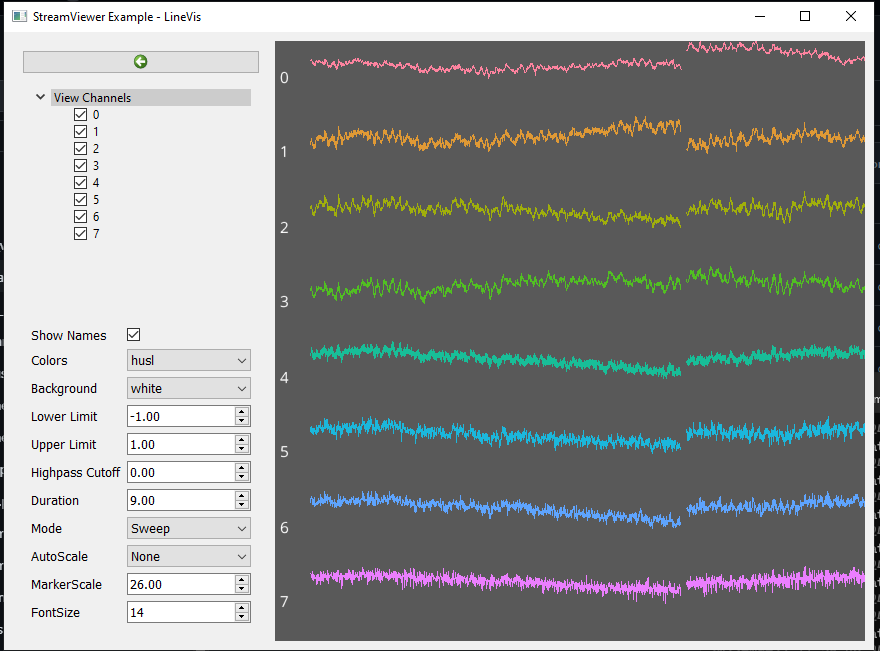
Note that the channel names are not displayed, this could be because the streaming example in BCI-essentials-python does not have the names on the stream.